
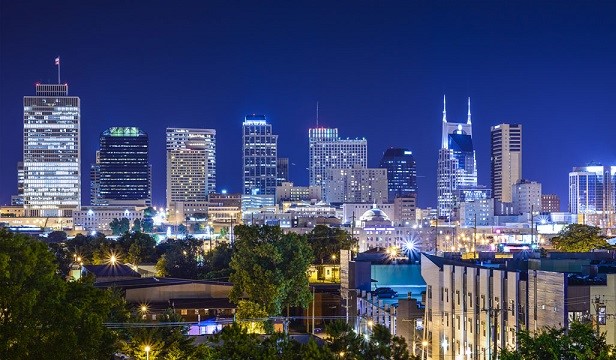
 Nashville has had the nation’s most dynamic office market, and illustrates how secondary cities have become so important.
CHICAGO—Tenants within the US office sector became a bit cautious during the winter, but leasing activity rebounded strongly in the second quarter, according to a new report from Cushman & Wakefield. Net occupancy grew, and nationally, landlords were able to push up rents to a new high. Furthermore, developers have ramped up construction, and experts say they see no sign of overbuilding.
“Construction is finally starting to catch up to absorption,” Ken McCarthy, C&W principal economist and author of the report, tells GlobeSt.com. “But this is still not a construction boom like we’ve seen in the past.”
In the second quarter, developers finished 16.1 million square feet of new office across the US, the largest amount since 2009. C&W estimates that in 2017 developers will complete more than 71 million square feet of new office space, the most in a single year since 2008. But construction levels remain 30% lower than the peaks recorded for the prior cycle and 60% lower than the records set during the Dotcom bubble.
In the second quarter, net absorption in the US increased to 12.8 million square feet, up from 6.3 million in the first quarter, but the national vacancy rate remained flat at 13.3%, another sign that construction has not gotten out of control. Since national asking rent bottomed in the second quarter of 2011, average asking rents have increased 23.6%.
And builders are currently most active in just 11 metro areas, generally the ones with the strongest absorption numbers in the past few years: Atlanta, Boston, Charlotte, Dallas/Fort Worth, Denver, Manhattan, Northern Virginia, San Francisco, San Mateo, Seattle and Washington, DC. Together, these areas account for 53.4 million square feet of the space under construction, representing 49.4% of the total pipeline.
Office rents also continue to rise, albeit at a slower pace. The average rent for all product types was $30.36 in the second quarter, up 4.4% compared to the same quarter one-year ago. Although C&W considers this a healthy level of growth, it remains slower than the 6.1% registered in mid-2016.
McCarthy says that many coastal and gateway markets have essentially reached full employment, and that means much of the new absorption occurred in secondary markets.
In the second quarter, the top 10 absorption markets were: Dallas/Fort Worth (1.4 million square feet), Charlotte (1.1 million), Seattle (940,000), Raleigh/Durham (718,000), Nashville (667,000), Northern Virginia (650,000), Baltimore (621,000), Miami (483,000), Atlanta (405,000) and Phoenix (374,000).
“But this isn’t a dramatic shift,” he adds. “We continue to see healthy absorption in core cities across the board.”
Of the 85 markets tracked by C&W, 66 recorded positive net absorption of office space, while 19 recorded declines.
At 6.9%, Nashville had the lowest vacancy rate of any market, even lower than top coastal markets such as Midtown South Manhattan (7.5%) and Seattle (7.7%).
“It’s been a growth city throughout this cycle,” says McCarthy. In fact, its 29.9% job growth since the bottom of the recession has been the second largest of any city. “It’s become a dynamic, emerging tech center.”