(This post has been updated.)
NEW YORK CITY—Add self-storage to the property types in which New York City is undersupplied. The nation's largest metro area tops the list of undersupplied markets for self-storage facilities, along with San Jose, Los Angeles, San Diego and Baltimore, CBRE Group said Monday. Other markets considered undersupplied include Portland, OR; Philadelphia; Minneapolis; Hartford, CT; and Orlando.
Conversely, Oklahoma City, Memphis, Columbus, Kansas City, Salt Lake City, Seattle, Tampa Bay-St. Petersburg, Dallas, Austin and Nashville are the top 10 oversupplied markets as compiled by CBRE in a report from the Self Storage Valuation Group at CBRE Valuation & Advisory Services. The report ranks market conditions based on occupancy, income and cap rate data in top metro markets based on Reis data, along with cap rate data from CBRE's second-quarter Investor Survey.
“Analysis by major metro markets can be useful for comparison from a national perspective but these metrics should not be relied upon for local area analysis,” says Christian Sonne, EVP of CBRE's Self Storage Valuation Group. “Factors that affect local self-storage product type include zoning regulations, local demographics, household income and density, among others.”
Sonne points out that that the best analytics for this sector are by local trade area. “From our Investor Surveys and zip code studies of existing facilities, it is clear the trade area for self-storage is relatively small, generally within a three-mile radius for a typical suburban property.”
In a June posting on SeekingAlpha.com, analyst Bill Stoller made the case for investing in self-storage REITs. “One advantage that self-storage has over most other REIT sectors is the ability to adjust rents on a monthly basis to take advantage of market supply and demand,” he wrote. “Additionally, self-storage benefits from the continued drop in US homeownership. On average, renters move three times as often compared to people who own their residences.”
Following the Great Recession, Stoller continued, “bank lending standards tightened, and it became difficult for local developers to finance the development of new self-storage projects. Notably, self-storage facilities open 100% vacant and can take three years or more to stabilize occupancy at 80% or more. The lack of supply of new self-storage properties has resulted in record high occupancies in many markets, and savvy operators have been pushing rents higher.”
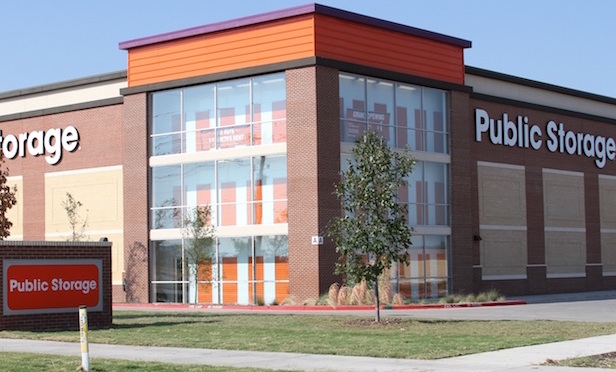
The Q2 operating metrics of the largest self-storage REIT, Glendale, CA-based Public Storage, provide a case in point. Net income was up year over year for the quarter ended June 30 and for the first six months of 2016—by nine cents and 25 cents per share, respectively—driven by NOI increases that in turn were driven by higher realized annual rent per occupied square foot.
For Extra Space Storage, the Q2 story was much the same. The Salt Lake City, UT-based REIT reported adjusted funds from operations of 94 cents per share for Q2, an increase of 25.3% over the year-ago period. CEO Spencer Kirk said last month that FFO growth was driven by “solid property performance, our growing third-party management platform, accretive acquisitions and mutually beneficial joint ventures.” The company also achieved net income attributable to common stockholders of $1.32 per diluted share, representing a 43.5% increase compared to Q2 of 2015.
(This post has been updated.)
Conversely, Oklahoma City, Memphis, Columbus, Kansas City, Salt Lake City, Seattle, Tampa Bay-St. Petersburg, Dallas, Austin and Nashville are the top 10 oversupplied markets as compiled by CBRE in a report from the Self Storage Valuation Group at CBRE Valuation & Advisory Services. The report ranks market conditions based on occupancy, income and cap rate data in top metro markets based on Reis data, along with cap rate data from CBRE's second-quarter Investor Survey.
“Analysis by major metro markets can be useful for comparison from a national perspective but these metrics should not be relied upon for local area analysis,” says Christian Sonne, EVP of CBRE's Self Storage Valuation Group. “Factors that affect local self-storage product type include zoning regulations, local demographics, household income and density, among others.”
Sonne points out that that the best analytics for this sector are by local trade area. “From our Investor Surveys and zip code studies of existing facilities, it is clear the trade area for self-storage is relatively small, generally within a three-mile radius for a typical suburban property.”
In a June posting on SeekingAlpha.com, analyst Bill Stoller made the case for investing in self-storage REITs. “One advantage that self-storage has over most other REIT sectors is the ability to adjust rents on a monthly basis to take advantage of market supply and demand,” he wrote. “Additionally, self-storage benefits from the continued drop in US homeownership. On average, renters move three times as often compared to people who own their residences.”
Following the Great Recession, Stoller continued, “bank lending standards tightened, and it became difficult for local developers to finance the development of new self-storage projects. Notably, self-storage facilities open 100% vacant and can take three years or more to stabilize occupancy at 80% or more. The lack of supply of new self-storage properties has resulted in record high occupancies in many markets, and savvy operators have been pushing rents higher.”
The Q2 operating metrics of the largest self-storage REIT, Glendale, CA-based
For Extra Space Storage, the Q2 story was much the same. The Salt Lake City, UT-based REIT reported adjusted funds from operations of 94 cents per share for Q2, an increase of 25.3% over the year-ago period. CEO Spencer Kirk said last month that FFO growth was driven by “solid property performance, our growing third-party management platform, accretive acquisitions and mutually beneficial joint ventures.” The company also achieved net income attributable to common stockholders of $1.32 per diluted share, representing a 43.5% increase compared to Q2 of 2015.
© Arc, All Rights Reserved. Request academic re-use from www.copyright.com. All other uses, submit a request to TMSalesOperations@arc-network.com. For more information visit Asset & Logo Licensing.