

LOS ANGELES–Industrial's story for the last few years has been nothing but growth and then more growth. Now, new numbers from CBRE Econometrics Advisors show that the distance between strong demand and what was once limited supply is beginning to tighten.
To be sure, net absorption continued to outpace completions in the first quarter of 2018 but the gap has narrowed, it said in a report. Net absorption and completions over four quarters were 215 million and 204 million square feet, respectively, meaning that excess demand was 11 million square feet — down significantly from 100 million square feet in Q1 2017. Going forward, a strong pipeline will mean that the demand-supply gap will likely fluctuate around zero, CBRE said.
“Underlying economic conditions for the industrial sector remain intact, with demand still robust and the supply pipeline strong,” Timothy H. Savage, Senior Managing Economist at CBRE Econometrics Advisors, said in a prepared statement.
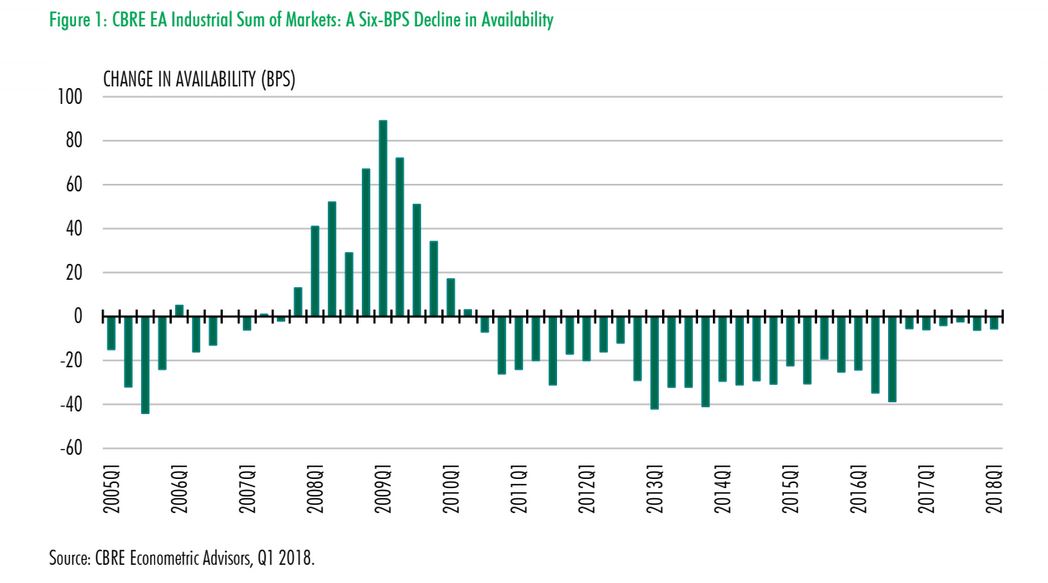
Currently the availability rate for CBRE Econometric Advisors' industrial Sum of Markets fell 6 basis points in the first quarter of 2018 to 7.3%, for an availability rate that was down 20 basis points over the year. Preliminary data for the quarter indicate net absorption of 42 million square feet with completions totalling 35 million square feet.
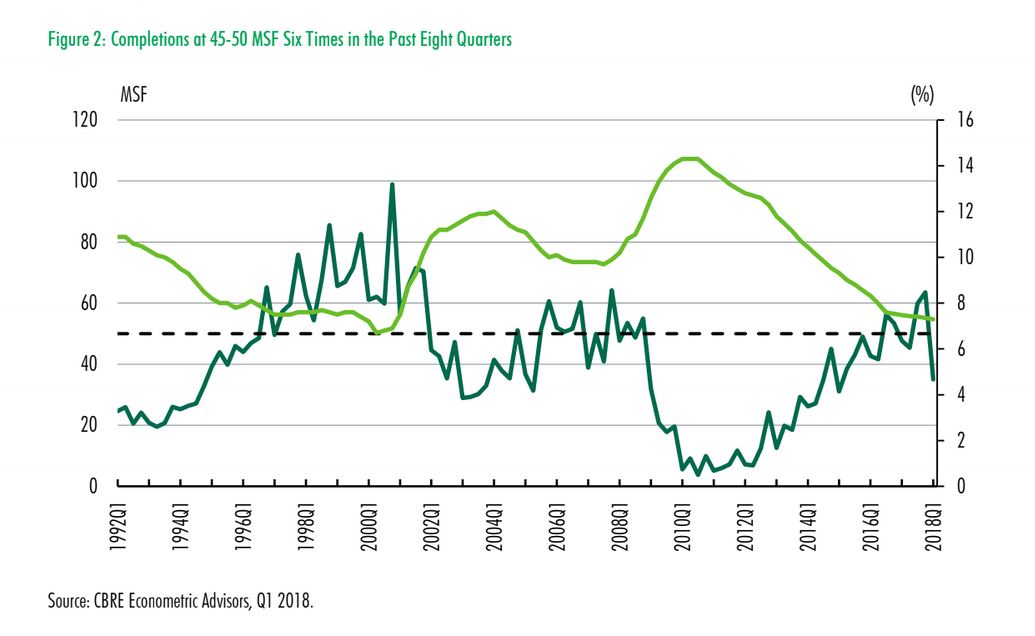
Except for this latest — and preliminary — data point, completions have registered above the 45 million to 50 million square feet threshold six times in the past eight quarters, the report said. Historically, whenever completions have remained in this range consistently, the availability rate has flattened out for some time before increasing.
Market by Market
The report found that availability declined in 31 markets during the quarter, rose in 25 and was unchanged in eight.
Some of the quarter's largest year-over-year declines were recorded in Dayton (-300 bps), Sacramento (-290), Tucson (-230), Jacksonville (-220), Memphis (-220) and Phoenix (-180).
Notable year-over-year increases were seen in Wilmington (520), Louisville (210), Austin (210), Charlotte (140), Pittsburgh (140), Allentown (120) and Dallas (110).
© Touchpoint Markets, All Rights Reserved. Request academic re-use from www.copyright.com. All other uses, submit a request to [email protected]. For more inforrmation visit Asset & Logo Licensing.
Erika Morphy

Erika Morphy has been writing about commercial real estate at GlobeSt.com for more than ten years, covering the capital markets, the Mid-Atlantic region and national topics. She's a nerd so favorite examples of the former include accounting standards, Basel III and what Congress is brewing.


