What Happened to Net Lease Over the Last Quarter?

Cap rates overall have seen an up-tick, but at a manageable pace, while core assets continue to trade at historically aggressive pricing

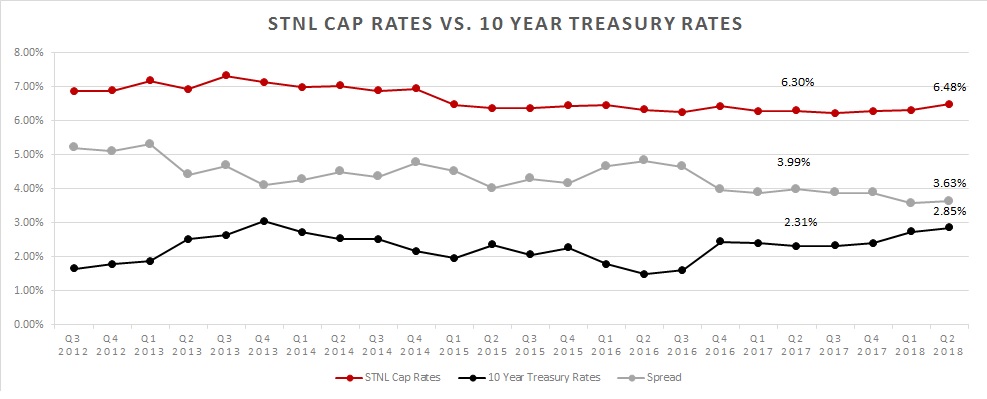
Cap rates are beginning to move, the average cap rate for single tenant net lease (STNL) properties rose 17 basis points from Q1. The major driver of this movement was a change in the types of leases, with more double-net leases closing during Q2. The pharmacy and automotive sectors had the largest uptick in cap rate. This is the third straight quarter over quarter gain in average cap rate.

Patrick Nutt, Calkain’s Managing Partner, remarked “Cap rates overall have seen an up-tick, but at a manageable pace, while core assets continue to trade at historically aggressive pricing.” While we can expect the cap rates of typical net leased properties to continue to rise, the trophy assets will remain highly demanded.

The Big-Box, C-Store, Dollar Store, Educational, QSR, and Other Retail sectors remained consistent from quarter to quarter, moving less than 20 basis points. The largest movement in cap rate was Sonic. Quarter-over-quarter Sonic’s cap rate gained 76.5 bps due to the changing number of years remaining. Burger King had the second largest change from quarter to quarter, 47 bps. While Burger King saw the average number of years fall slightly a decrease in the number of properties selling in premium markets, such as Florida or California, was the real driver of a higher average cap rate.

The spread between the 10-year treasury notes and the STNL average has remained under 4% for the last seven quarters. This narrow spread has put upwards pressure on cap rates. We expect cap rates to continue to rise in the future.

Read our full Q2 2018 Cap Rate Report for more details.

The views expressed in this article are the author’s own and not that of ALM’s Real Estate Media Group.