
 Paul Fiorilla
Opportunity zones are the latest big thing to hit the commercial real estate market, but many questions remain, including details of how deals can be structured, the best strategy for investing and just how much property there is in the zones.
Transaction activity has so far been muted as industry players try to understand the ground rules and raise capital in vehicles that will meet the needs of investors and withstand structural scrutiny. However, one thing is certain: the opportunity is enormous.
A study of Yardi Matrix's database found that within opportunity zones there are either in place or under construction 1.9 million multifamily units, 960 million square feet of office space and 180 million square feet of self-storage space. As a percentage of total space, properties in opportunity zones that are in place or under construction represent 13.1% of total multifamily units nationwide, 13.7% of total office space and 11.4% of total self-storage space.
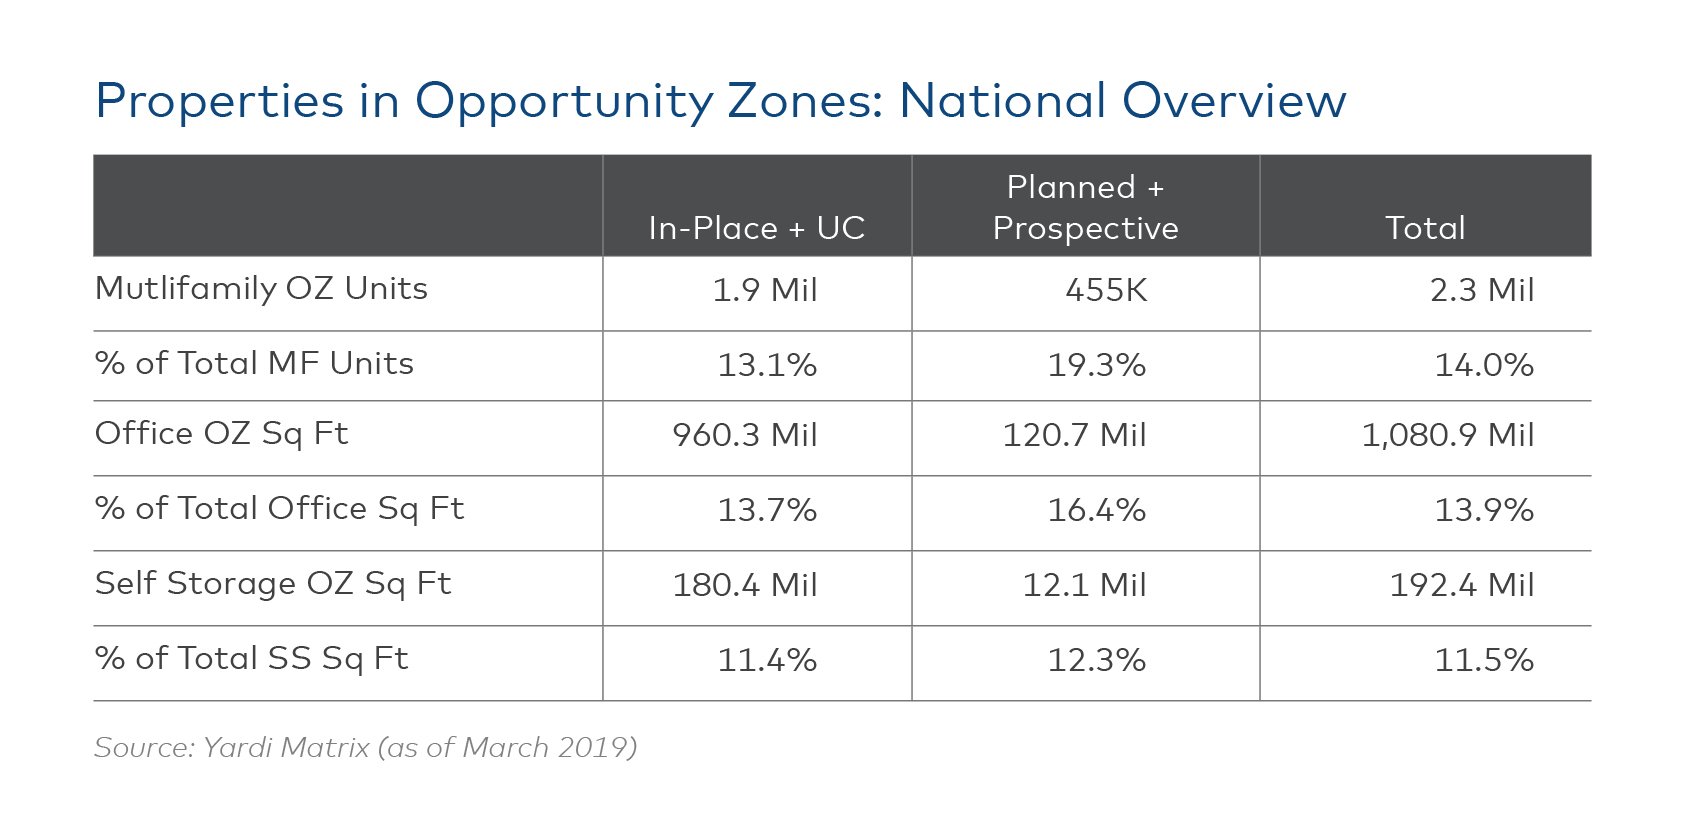
The development pipeline in those zones – projects that either have (or are in the process of getting) government approvals to build but have not broken ground – encompasses 450,000 multifamily units, 120 million square feet of office space, and 12 million square feet of self-storage space. Ground-up development is likely to be a major focus of opportunity fund capital, since the law requires investors to significantly increase the basis of assets purchased. For properties in place, that would mean buildings in need of wholesale improvements, which limits the pool of potential assets that would qualify.
The potential is highest in the multifamily sector, where the number of planned and prospective units represent 24.2% of total stock within opportunity zones. In office, planned and prospective projects represent 12.6% of total space, while the percentage is only 6.7% in the self-storage segment.
While it would seem intuitive that average rents of properties in opportunity zones – defined as areas with below-average income and higher-then-average unemployment – would be less than the market average, the data shows no clear pattern.
Metro Focus
Opportunity zones were created by tax reform passed in December 2017. Investors in these areas may defer capital gains taxes and avoid paying taxes on gains if the property is held for at least 10 years. The legislation has set off a flurry of activity among fund managers, developers and investors that are looking to take advantage of the new rule.
The heart of the program is an incentive to reinvest capital gains, which must be placed in a qualified “opportunity zone fund.” Funds can be single-purpose vehicles or commingled. Shareholders who keep their investments for five years will pay no taxes on 10 percent of the investment's gains. After seven years, 15 percent of the gains will not be taxed. Shareholders who hold opportunity zone investments for 10 years can avoid paying taxes on all gains. Among the qualified investments are real estate, businesses, and infrastructure.
The aim of opportunity fund legislation is to stimulate investment in distressed and low-income areas. Opportunity zone tracts have above-average unemployment rates and income significantly below the regional median. More than 8,700 areas in the U.S., encompassing roughly 10% of the U.S. population and 12% of the land, were designated by states and certified by the Treasury Department as opportunity zones. On average, income of residents in opportunity zone funds is about 60% of the area median income. The tracts are a mix of rural, urban and suburban.
When broken down by volume of commercial real estate opportunities, urban areas naturally had the most potential property investments. However, the amount of properties in opportunity zones was not strictly correlated with total metro size. Manhattan, for example, is by far the largest U.S. office market, but is among the lowest in terms of percentage of opportunity zone space because office buildings are generally located in areas with high-income residents.
An example of this disconnect on the multifamily side is the Richmond, Va., metro, which has 45,000 apartment units located in opportunity zones, the fifth most in the nation. Richmond has almost as many multifamily units in opportunity zones as Manhattan and Brooklyn, despite being a fraction of the overall size. The discrepancy has to do with the average income of residents and the way states composed the zones.
There are significant differences in metro results by property type:
Multifamily
Metros with the most in place and under construction units include the Washington D.C. metro (55,000), Phoenix (54,000) and Brooklyn (49,000). Combined, Brooklyn and Manhattan total 96,000 units and West Houston and East Houston account for 82,000. Brooklyn (32%), Portland (23%) and Cleveland (22%) had the highest proportion of in-place units in opportunity zones. High-income submarkets Fort Worth (1%), North Dallas (3%) and the San Francisco Peninsula (4%) had the lowest proportion. Miami (27,300), Los Angeles (25,400), Washington D.C. (25,000) and Northern New Jersey (20,000) had the largest development pipelines in designated opportunity zones.
Metros with the highest percentage of units in the pipeline in opportunity zones were Cleveland (70%), Detroit (57%), Brooklyn (41%) and East Los Angeles (40%).
Metros in which apartment rents in opportunity zones lagged the metro average urban Chicago ($869), the San Francisco Peninsula ($792) and West Palm Beach ($522). Metros in which apartment rents in opportunity zones were higher than the metro average include urban Philadelphia ($410), Brooklyn ($344), Bridgeport-New Haven ($310) and East Los Angeles ($257). 
Office
Metros with the most office square feet in place or under construction in opportunity zones are Houston (61 million), Detroit (41 million), Portland (37 million) and Los Angeles (32 million). By percentage of stock, the metros with the most are Portland (51%), Cleveland (45%), Brooklyn (38%) and Detroit (35%).
Metros with the most office space in the development pipeline in opportunity zones are Washington, D.C. (59 million square feet), the Bay Area (58 million), Dallas-Fort Worth (50 million) and Atlanta (41 million). Metros in which the development pipeline in opportunity zones represents the highest potential growth in those zones are Cleveland (67%), Columbus (60%) and Philadelphia (55%).
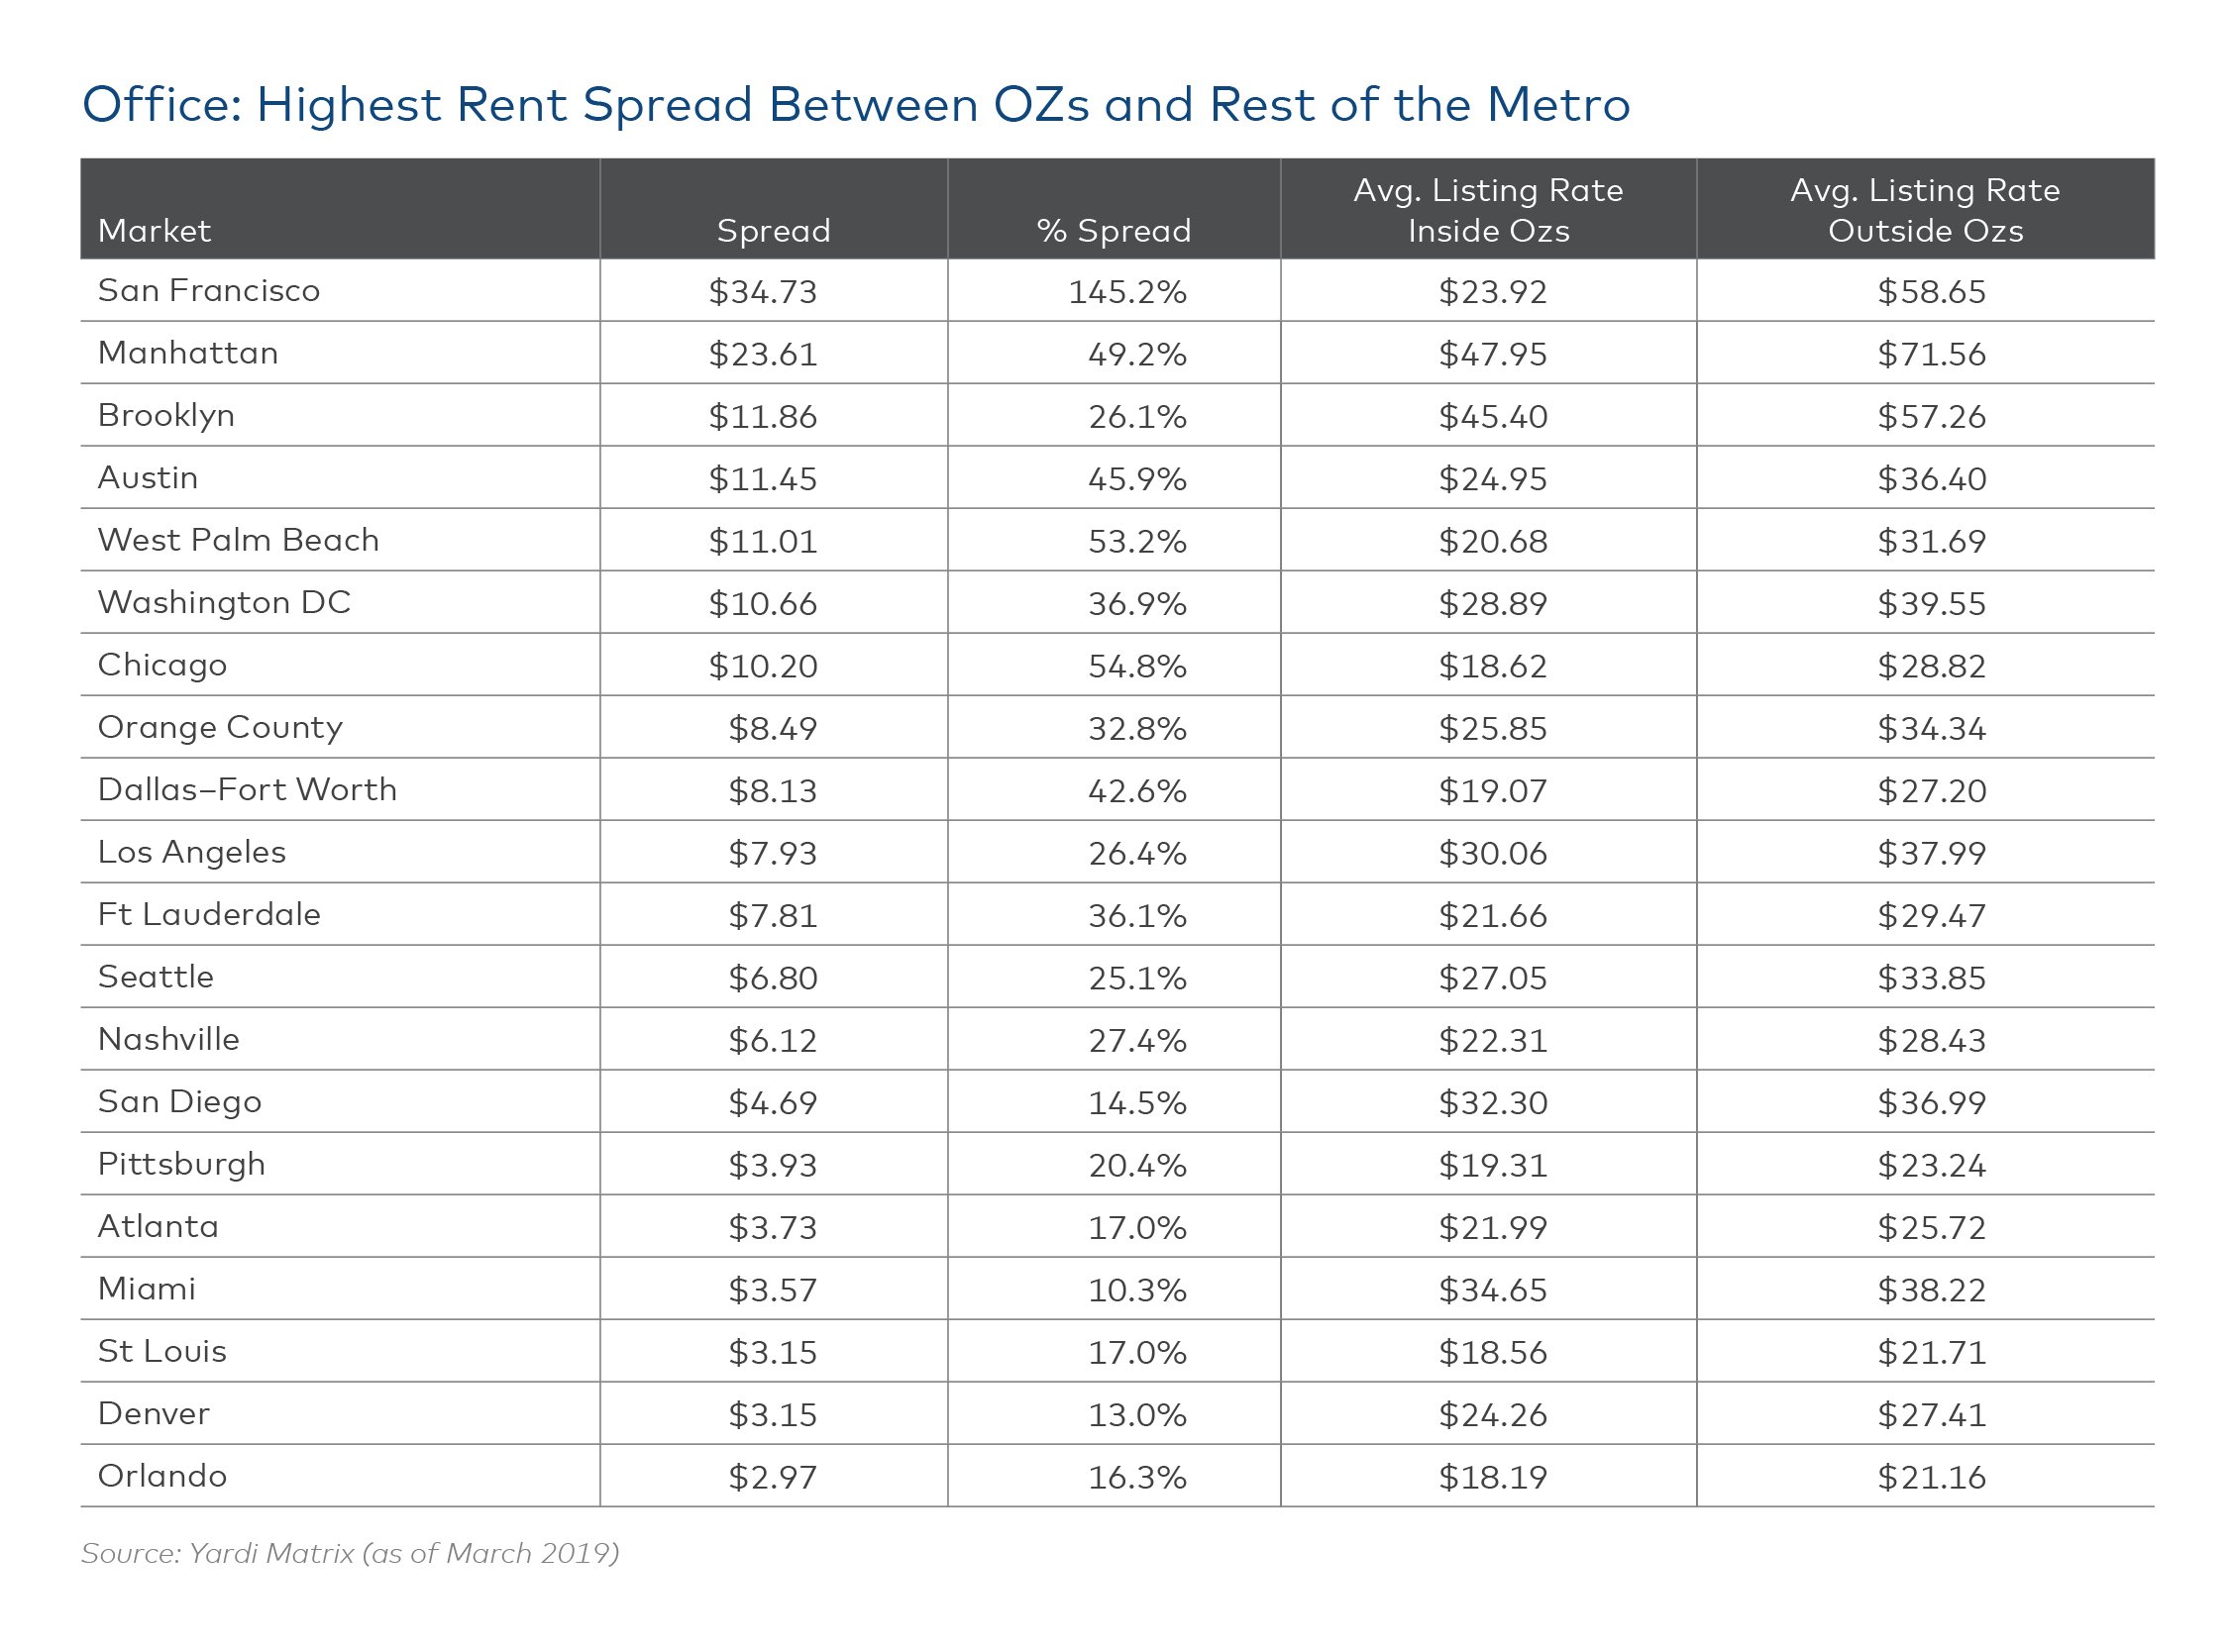
Metros in which office asking rents in opportunity zones were the most below the metro average are San Francisco ($37.43), Manhattan ($23.61), Brooklyn ($11.86) and Austin ($11.45). Markets in which office asking rents are higher in opportunity zones than the rest of the metro include Portland ($7.45), Houston ($6.55), Central New Jersey ($6.41) and Tampa ($5.52).
Self-Storage
Metros with the most in-place and under construction self-storage space in opportunity zones are Richmond (6.2 million square feet), Phoenix (5.9 million), Inland Empire (5.3 million) and Brooklyn (4.2 million). The most concentrated metros as a percentage of square feet include Brooklyn (54%), Richmond and Miami (22%) and Washington D.C. (18%). The data measures 10×10 foot storage units.
The most planned and prospective self-storage space in opportunity zones are in Portland (1.2 million square feet), Phoenix (734,000), Miami (642,000) ad Central New Jersey (526,000). Metros in which average self-storage rents in opportunity zones are most below the metro average are Manhattan ($74), San Francisco Peninsula ($62), Bay Area ($30), Fort Worth ($26) and Northern Virginia ($23). The highest percentage spread is in San Francisco (39%), Fort Worth (38%), Suburban Twin Cities (26%), Manhattan (24%) and Atlanta (21%). 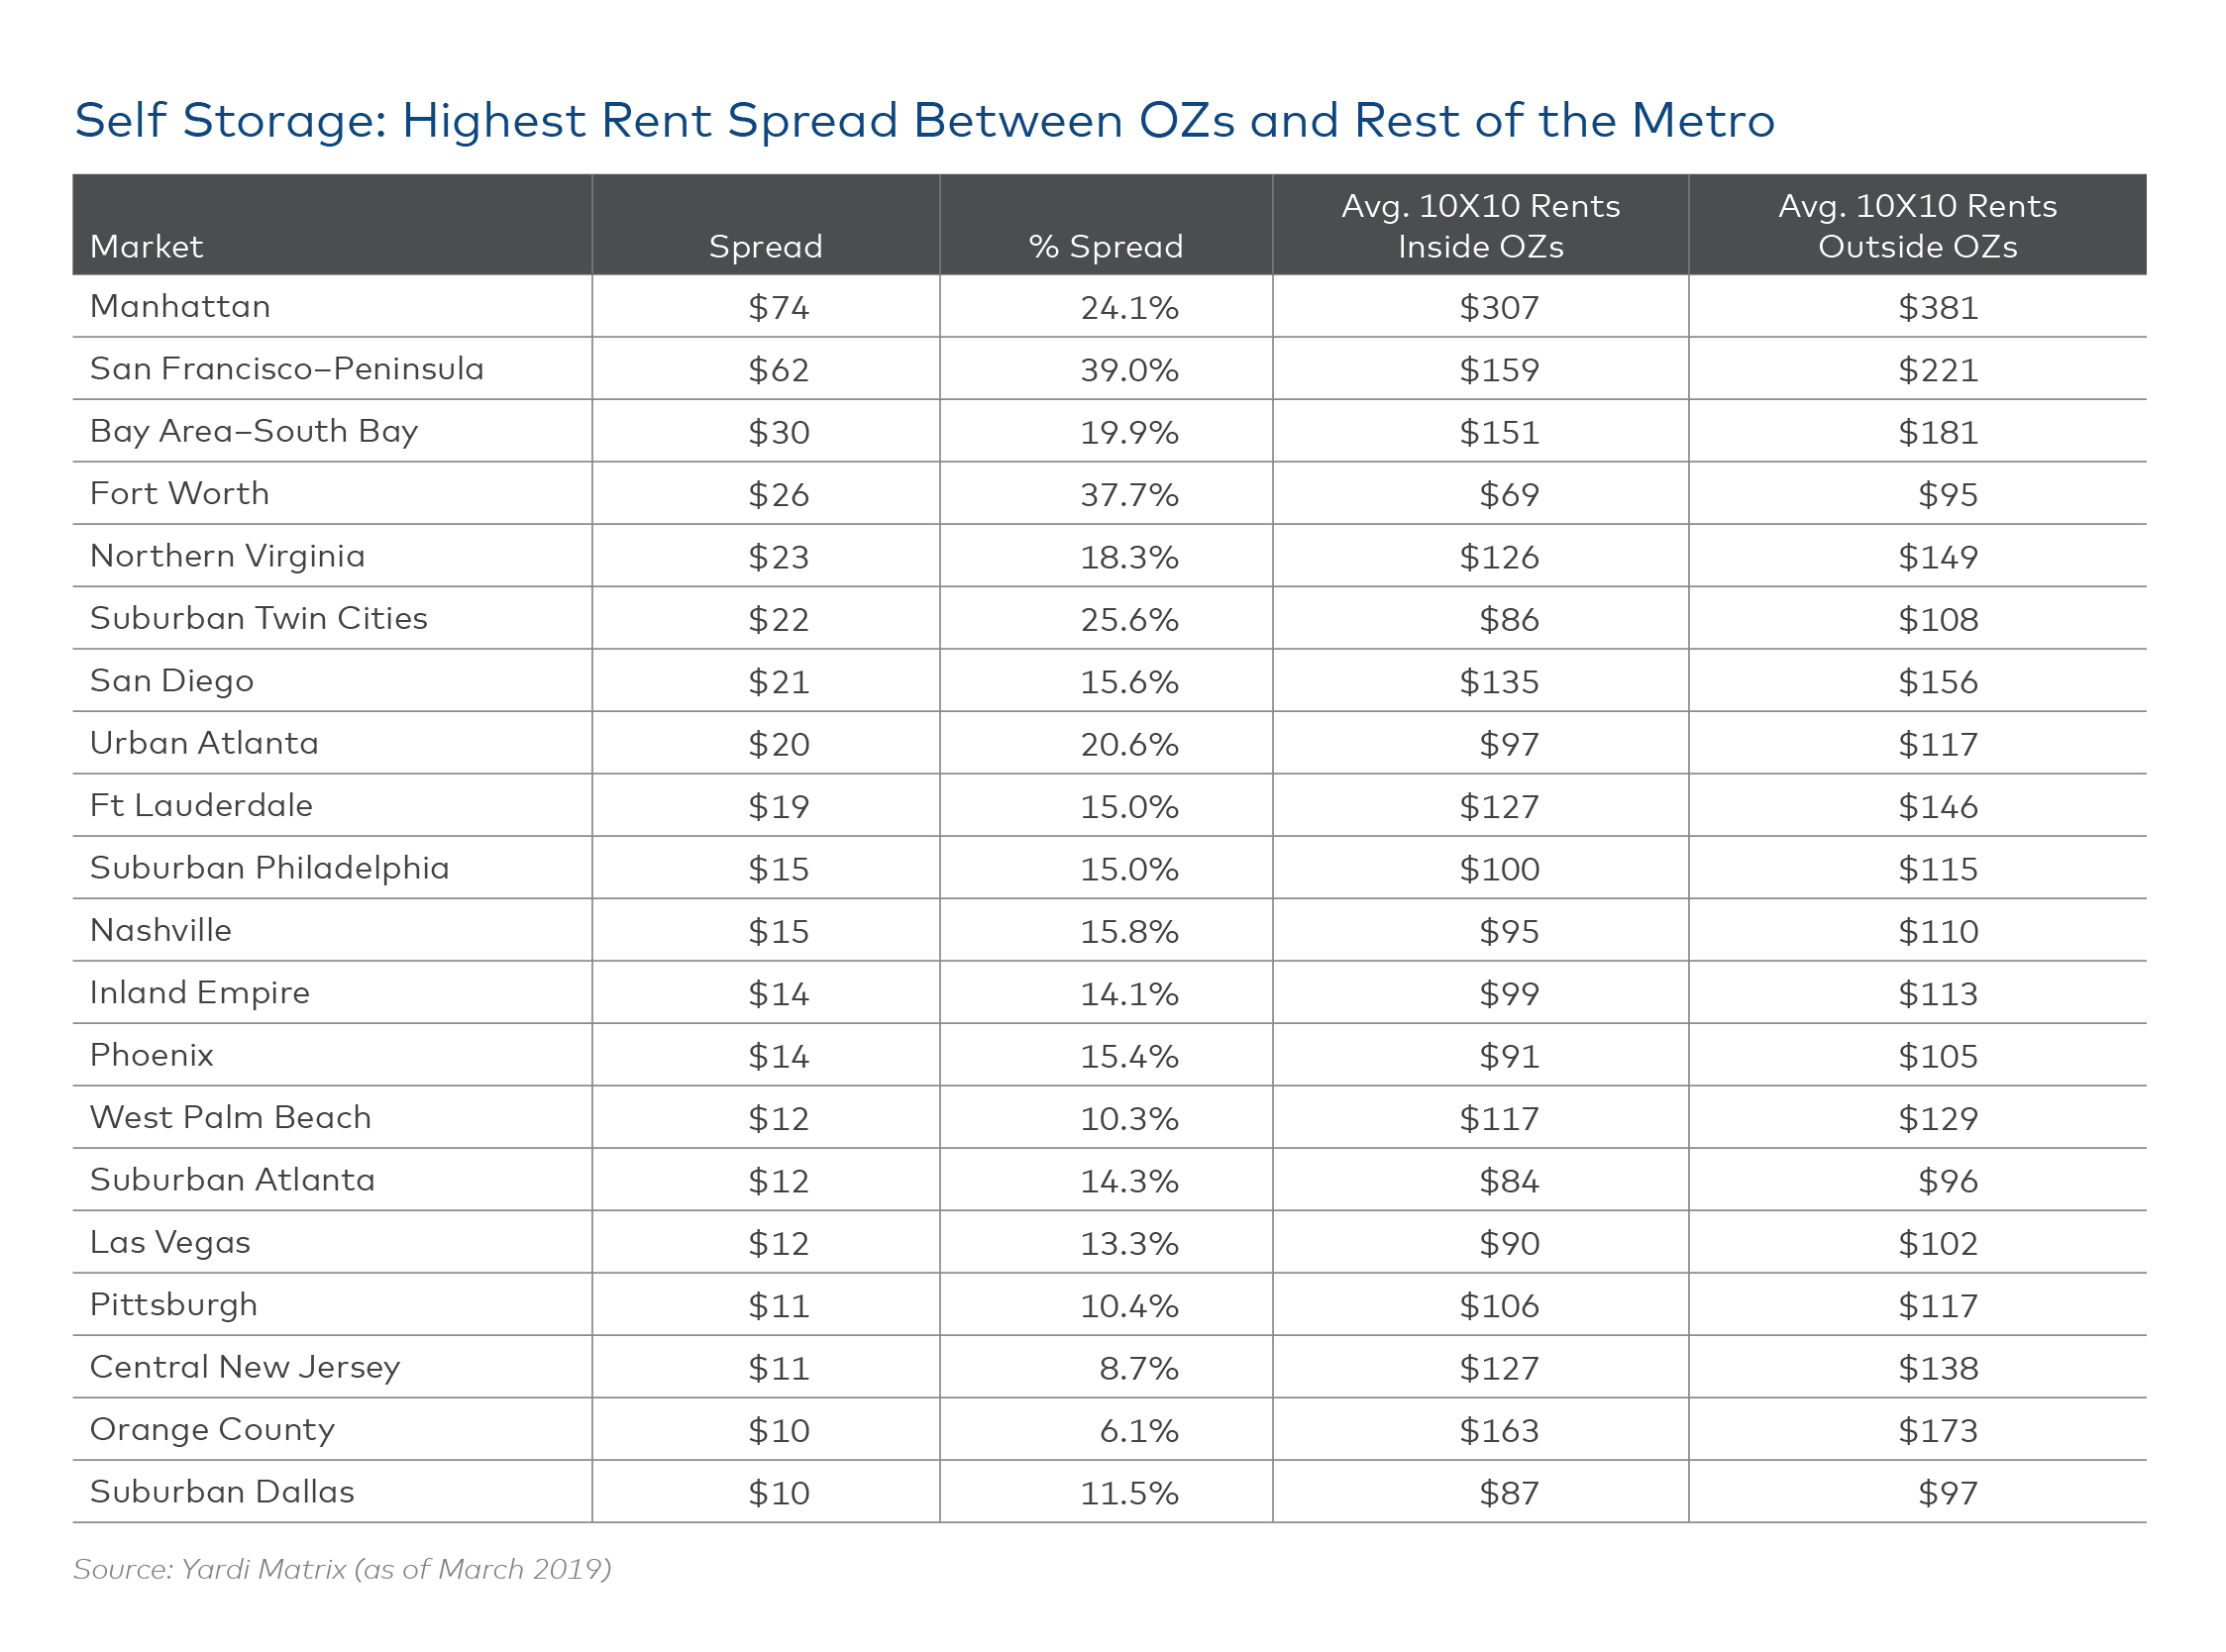
Diversity Within Opportunity Zones
A common strategy of investors in distressed areas is to buy assets that are relatively inexpensive and add value by redeveloping the structure and bringing in tenants at higher rents. Key to this strategy is to find properties or submarkets that have below-market values and rents. However, just because a property is in an opportunity zone doesn't mean there is outsized potential to raise rents. In most metros the average rent in opportunity zones is less than the average rent of properties in the metro outside of opportunity zones, but by no means is there a clear pattern.
There are several reasons for the lack of clarity in the rent data, mostly owing to the way the zones were drawn. For one thing, the employment and income data used to identify eligible census tracts was from an average of the 2011-2015 American Community Survey. Some communities have experienced growth and/or gentrification in the intervening years and might not qualify if more recent numbers were used. About three quarters of the jobs created since the Great Recession have been in the top 25 urban areas and many rural communities have not recovered from losing a manufacturing plant or other major industry.
In some cases, the numbers are skewed by small sample sizes: there are few properties of one type or another in some low-income areas. Another factor is that the states were given a fair amount of leeway to set up the zones, and they employed different strategies. Some states focused more on urban areas while in others the designated zones were spread throughout the state.
What's more, as small as they are, many census tracts designated as opportunity zones have a range of neighborhoods that defy simple characterizations such as high-income or low-income. One well-known example is Long Island City, a section of the borough of Queens in New York City. Long Island City has had it struggles as industries left in past decades but has rapidly gentrified in recent years and was selected by Amazon as the location of an east coast headquarters before the company changed its mind.
Strategies for Investing
Opportunity zones have become an area of intense interest in the commercial real estate market. For one thing, the segment represents an entirely new area of outlays in a market that has for years far more capital seeking assets than available investments. Opportunity zones also provide the potential to draw from a new base of largely untapped investors and the potential of new markets that were thought to be too small or risky as investment strategies.
Another factor is that opportunity zones give commercial real estate investors the potential for higher yields at the tail end of a nine-year bull market when acquisition yields are at or near all-time lows. The spread between returns on stable assets in primary markets and value-add/secondary market properties has slowly tightened over the course of the cycle.
However, the risks are significant as well. Investing in low-income or areas in which are starved of business investment is inherently more volatile than core, stabilized markets. Performance of real estate in tertiary markets and low-income areas historically has been spotty.
Having favorable tax status is a good start, but it's no substitute for demand that produces income. There is money to be made injecting much-needed capital in markets that have been ignored, but to be successful funds need to be prepared to be in it for the long haul and have a wholistic approach to development. Otherwise investors could find themselves rehabilitating properties that are underused. The long-term benefit of the program – no taxes on gains – only works if the projects create value.
Investments should be carefully thought out and made in conjunction with local governments and businesses. Areas most likely to see growth in demand are those where there are public and private investments made in education, transportation and infrastructure to stimulate economic activity. To find the right zones to place capital, investors should have detailed submarket knowledge, relationships with local stakeholders and access to data such as Yardi Matrix that enables them to analyze the relative strengths of submarkets, neighborhoods and even individual buildings.
Paul Fiorilla is the Director of Research at Yardi Matrix.
© Touchpoint Markets, All Rights Reserved. Request academic re-use from www.copyright.com. All other uses, submit a request to [email protected]. For more inforrmation visit Asset & Logo Licensing.


