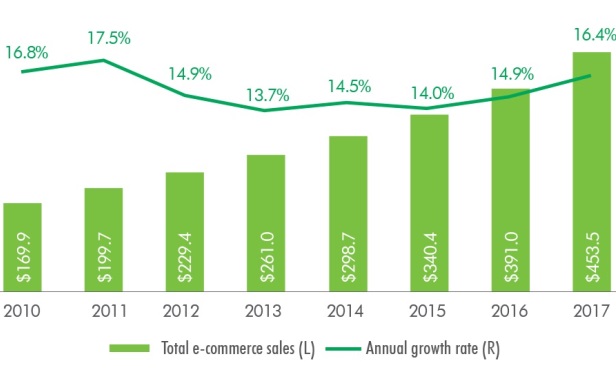
 E-commerce sales totaled $453.5 billion in 2017, growing at an annual average of 15% since 2010 (credit: CBRE).
SAN JOSE—E-commerce accounts for almost 9% of total US retail sales today and has been growing nearly three times faster than brick-and-mortar sales since 2010, according to CBRE research. E-commerce sales totaled $453.5 billion in 2017, growing at an average of 15% annually since 2010, according to the US Census Bureau.
E-commerce is defined as sales of goods and services through digital channels (Internet, mobile device, etc.). E-commerce sales include Internet sales of pure-play e-tailers (retailers that operate solely online) and the online sales of brick-and-mortar brands (i.e., a purchase made through a physical store brand's website). Not included in these e-commerce sales is revenue from online travel services, financial brokers and ticket sales agencies.
The most common method for measuring e-commerce share is by comparing total e-commerce sales to total retail sales, which includes sales across all categories except restaurants and bars. Using this method, the e-commerce share of total retail sales was 8.9% in 2017, according to the Census Bureau.
However, e-commerce share varies depending on what retail categories are included or excluded in the retail sales figure. For example, if restaurant sales are included in overall retail sales, the 2017 e-commerce share drops slightly to 7.9%. On the other hand, if generally considered typical mall category sales are isolated, that figure jumps to 26.2%. This includes sales of furniture and home furnishings, electronics and appliances, clothing and accessories, sporting goods, hobby, books and music, general merchandise and office supplies, and stationery and gifts.
A hallmark of e-commerce is superior service—a nearly infinite number of choices, fast delivery and flexible return options. The impact of this growth on the supply chain is profound. This pressure has driven demand for industrial real estate to nearly unprecedented levels and has fundamentally changed the look of the modern warehouse.
It is commonly thought that an e-commerce supply chain requires up to three times more warehouse and logistics space than a traditional brick-and-mortar supply chain. Anecdotal evidence suggests that this is true, but a recent CBRE research study found that for each incremental $1 billion growth in e-commerce sales, an additional 1.25 million square feet of distribution space is needed to support this growth. This suggests that of the 236 million square feet that was absorbed in 2017, approximately 30% of it was attributable to e-commerce.
Demand for efficient logistics space that facilitates quick movement of goods to consumers has necessitated design of new warehouses that are larger in size and height. The average new warehouse in the US has increased by 108,665 square feet (143%) in size, says CBRE.
Distribution markets that serve major population centers and have land for new warehouses had building sizes increase the most, including Atlanta, the Inland Empire and Cincinnati. Rapidly growing e-commerce sales are the primary driver of this trend, and markets lacking sufficient modern logistics facilities have further expansion potential ahead to keep pace with this rising demand.
Given all of this, it is no surprise that e-tailers are spending big to keep the attention of buyers, to the tune of some $30 million in 2018 Super Bowl ad buys, according to a study by Numerator. This spend will undoubtedly increase for this year's big game.
Major categories and advertisers that were featured during the 2018 Super Bowl broadcast ranged from laundry detergent to tourism. The top five categories by ad spend were automobiles at $90 million, beer at $40 million, entertainment at $37.5 million and soda by $25 million. The e-tailer spend is wedged between entertainment and soda.
"Advertisers took advantage of 2018 Super Bowl program viewing rate and shelled out an estimated $495 million in TV ad spend, up from $462.5 million in 2017, according to Numerator's ad spend data," Ryne Misso, Numerator's director of marketing, tells GlobeSt.com. "Super Bowl viewers are a more valuable group of shoppers than non-Super Bowl watchers year-round, as we discovered from data in a 2018 survey by Numerator's InfoScout OmniPanel of over 13,000 Super Bowl viewers. They spend 9% more per year on core CPG products and consumer electronics than people who do not watch the Super Bowl."
In a Numerator survey of 1,000 Super Bowl spectators, viewers said they watch the majority of commercials during halftime (48%) and first quarter (19%).
The top 10 brands by ad spend during the 2018 Super Bowl broadcast were the winter Olympics at $35 million, Toyota at $25 million, Jeep at $20 million, Ram at $20 million, Budweiser at $15 million, Coca-Cola at $15 million, Tide at $15 million, Amazon Alexa at $15 million, TurboTax at $12.5 million and Verizon Salute at $12.5 million.
Lisa Brown
Lisa Brown is an editor for the south and west regions of GlobeSt.com. She has 25-plus years of real estate experience, with a regional PR role at Grubb & Ellis and a national communications position at MMI. Brown also spent 10 years as executive director at NAIOP San Francisco Bay Area chapter, where she led the organization to achieving its first national award honors and recognition on Capitol Hill. She has written extensively on commercial real estate topics and edited numerous pieces on the subject.